YouTube Gaming vs Twitch Viewership Statistics (2025)
YouTube Gaming vs Twitch Viewership Statistics: 2025 Market Analysis
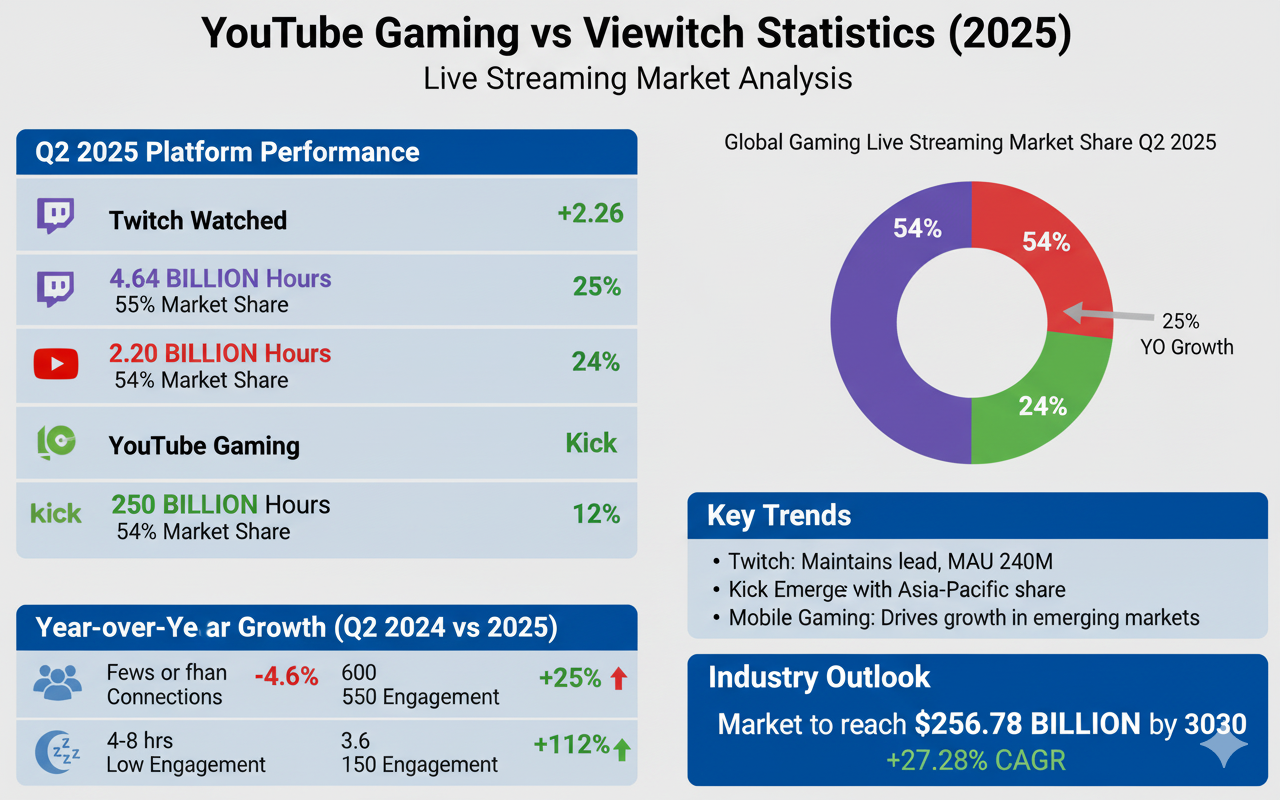
The live streaming gaming industry continues its evolution in 2025, with YouTube Gaming vs Twitch viewership statistics revealing significant market shifts. While Twitch maintains its position as the dominant gaming streaming platform with 54% market share, YouTube Gaming has achieved remarkable growth, reaching a record 2.2 billion hours watched in Q2 2025. This comprehensive analysis examines the latest viewership data, market trends, and competitive dynamics shaping the streaming landscape.
Twitch Hours Watched
Q2 2025 total hours watched
YouTube Gaming Hours
Record quarterly viewership
Twitch Market Share
Gaming live streaming market
YouTube Gaming Share
Growing market presence
Live Streaming Market Overview 2025
The global live streaming gaming market generated approximately 8.5 billion hours watched across all platforms in Q2 2025, representing a 5% year-over-year increase. This marks the highest quarterly viewing figures since 2021, demonstrating the continued growth of digital entertainment consumption. Gaming content creation remains the primary driver of viewership across major streaming platforms.
Twitch Viewership Statistics 2025
Twitch viewership remains substantial with 240 million monthly active users and 35 million daily active users as of 2025. The platform’s concurrent viewers average 2.29 million, though this represents a slight decline from 2024’s 2.55 million average. Despite market share challenges, Twitch continues to dominate gaming live streams with significant audience engagement.
Twitch Monthly Active Users Growth
Monthly active users have grown steadily, with the United States accounting for approximately 35 million users, representing 23.1% of Twitch’s global user base. The platform projects reaching 36.7 million US users by the end of 2025, reflecting consistent growth in key markets.
Twitch Hours Watched Trends
Platform-wide viewing hours reached 20.8 billion in 2024, with projections indicating over 23 billion hours by end of 2025. While experiencing some decline in market share, absolute viewing hours continue growing, demonstrating Twitch’s strong position in live streaming analytics.
YouTube Gaming Statistics and Growth
YouTube Gaming experienced exceptional growth in 2025, with 25% year-over-year increase in Q2 viewership. The platform’s market share expanded from approximately 22% to 24%, positioning it as a formidable competitor in the gaming streaming space. This growth stems from strategic advantages including integrated VOD content, mobile optimization, and strong performance in emerging markets.
YouTube Gaming Regional Performance
YouTube Gaming demonstrates particular strength in Southeast Asian and Latin American markets, capitalizing on mobile-first viewing behavior. Popular titles like Mobile Legends and Free Fire drive significant engagement in these regions, contributing to the platform’s overall viewership growth.
Gaming Streaming Platform Comparison
| Platform | Q2 2025 Hours Watched | Market Share | Year-over-Year Growth | Monthly Active Users |
|---|---|---|---|---|
| Twitch Gaming | 4.64 billion hours | 54% | -4.6% | 240 million |
| YouTube Gaming | 2.20 billion hours | 24% | +25% | Not disclosed |
| Kick | 1+ billion hours | ~12% | +112% | Not disclosed |
| Others | ~850 million hours | ~10% | Variable | Various |
Live Streaming Concurrent Viewers Analysis
Concurrent viewers represent a critical metric for understanding real-time engagement across platforms. Twitch maintains an average of 2.29 million concurrent viewers in 2025, though individual events can generate massive spikes. La Velada del Año 5 reached 9.19 million concurrent viewers on Ibai’s channel, demonstrating the platform’s capacity for large-scale event viewership.
Peak Viewership Events
Major gaming events and tournaments continue driving peak viewership across platforms. Nintendo’s Switch 2 announcement on YouTube achieved 3.3 million peak concurrent viewers, while esports tournaments regularly generate millions of simultaneous viewers across multiple platforms.
Streaming Platform Revenue and Creator Economics
Revenue sharing models significantly impact creator decisions between platforms. Twitch offers 50% subscription revenue sharing (70% for Partner Plus), while Kick provides 95% revenue sharing to creators. YouTube Gaming leverages its integrated ecosystem for diverse monetization opportunities including VOD content, shorts, and traditional advertising revenue.
Creator Monetization Comparison
The creator economy on streaming platforms varies significantly based on revenue models, audience size, and engagement patterns. Twitch generated approximately $1.8 billion in revenue during 2024, with subscriptions accounting for 58% of total revenue. Streaming monetization strategies continue evolving as platforms compete for top creators.
Gaming Streaming Market Share Trends
Market share dynamics reveal shifting competitive landscapes in gaming streaming. While Twitch’s market share declined from approximately 58-70% to 54% in 2025, absolute viewership continues growing. YouTube Gaming’s expansion from 17% to 24% market share indicates successful growth strategies and platform improvements.
Emerging Platform Impact
Kick’s emergence as a significant competitor with over 1 billion hours watched and 112% year-over-year growth demonstrates the dynamic nature of the streaming market. The platform’s creator-friendly policies and generous revenue sharing attract established streamers seeking alternatives to traditional platforms.
Popular Games and Content Categories
Content preferences continue shaping viewership patterns across platforms. League of Legends maintains its position as the most-watched game on Twitch with over 1.67 billion views, while Just Chatting represents the fastest-growing non-gaming category. Grand Theft Auto V, VALORANT, and Fortnite complete the top gaming categories driving gaming viewership trends.
Content Diversification Trends
Non-gaming content accounts for 32% of total watch time on Twitch, indicating successful platform diversification beyond traditional gaming streams. This includes music streams, educational content, and lifestyle programming that attracts broader audiences.
Mobile Gaming and Regional Markets
Mobile gaming represents a crucial growth driver for streaming platforms, particularly in emerging markets. YouTube Gaming’s strength in mobile-centric regions, combined with games like Mobile Legends: Bang Bang and Garena Free Fire, contributes significantly to overall platform growth and viewer engagement.
Global Market Distribution
Geographic distribution of viewers impacts platform strategies and content focus. The United States leads Twitch viewership with 23.1% of global users, while YouTube Gaming demonstrates stronger performance in Asia-Pacific regions where mobile gaming dominates entertainment consumption.
Future Projections and Industry Outlook
The live streaming market projects continued growth, with analysts forecasting the industry to reach $256.78 billion by 2030, growing at 27.28% CAGR. Key growth drivers include 5G adoption, increased mobile usage, expanding esports ecosystems, and emerging technologies like AR/VR integration shaping the future of live streaming technology.
Technology and Platform Innovation
Platform innovation continues driving competitive advantages through improved streaming quality, lower latency, and enhanced viewer interaction features. Both Twitch and YouTube Gaming invest heavily in creator tools, monetization improvements, and enhanced viewer experiences to maintain market position.
Frequently Asked Questions
What is the current market share difference between YouTube Gaming and Twitch?
As of Q2 2025, Twitch holds 54% of the gaming live streaming market with 4.64 billion hours watched, while YouTube Gaming accounts for 24% with 2.2 billion hours watched. This represents a narrowing gap as YouTube Gaming has grown from approximately 17% market share in previous years.
How many users watch Twitch daily compared to monthly?
Twitch has 240 million monthly active users and 35 million daily active users in 2025. This indicates strong user engagement with approximately 14.6% of monthly users accessing the platform daily, demonstrating consistent viewing habits among the user base.
Which platform offers better monetization for creators?
Creator monetization varies by platform: Twitch offers 50% subscription revenue sharing (70% for Partner Plus), YouTube Gaming provides integrated monetization through VOD content and advertising, while Kick offers the most generous 95% revenue sharing model. The best choice depends on creator goals and audience size.
What are the most popular games on streaming platforms?
League of Legends leads with over 1.67 billion views on Twitch, followed by Grand Theft Auto V with 1.4 billion hours. VALORANT, Fortnite, and Call of Duty round out the top five most-watched gaming titles across streaming platforms in 2025.
How has the live streaming market grown in 2025?
The live streaming market reached 8.5 billion hours watched in Q2 2025, representing a 5% year-over-year increase and the highest quarterly figures since 2021. This growth is driven by increased mobile usage, esports expansion, and diversified content offerings across platforms.
Sources:
1. GameHub – Stream Hatchet Q2 Report: YouTube Gaming Hits All Time High
2. Business of Apps – Twitch Revenue and Usage Statistics: Twitch Statistics 2025
4. Backlinko – Twitch Usage Statistics: How Many People Use Twitch
5. SQ Magazine – Twitch Statistics 2025: Key Growth & Viewership Data